

Are you ready to take your business to new heights through data-driven insights and informed decision-making?
In today’s fast-paced digital landscape, having the right tools at your disposal can make all the difference.
Welcome to our comprehensive guide on the Top 10 Tools for Business Analytics, where we’ll unveil the ultimate arsenal of instruments to transform raw data into actionable strategies.
Why Embrace Business Analytics Tools?
Have you ever wondered how industry leaders seem to predict trends, optimize operations, and refine marketing strategies with uncanny accuracy?
The answer lies in their adept use of business analytics tools. These tools enable you to dive deep into your data, extracting valuable insights that were once hidden beneath layers of complexity.
Whether you’re a startup entrepreneur or a seasoned business owner, the world of analytics tools opens up a realm of opportunities to drive growth and innovation.
Discover the Power of These Top 10 Tools for Business Analytics!
Let’s dive deeper into each of the top 10 business analytics tools:
1. Tableau
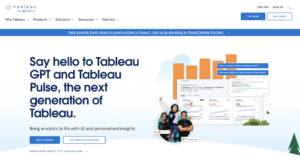
Tableau is a leading data visualization tool that allows users to create interactive and visually appealing dashboards and reports. Its drag-and-drop interface enables users to connect to various data sources, blend and transform data, and create insightful visualizations without needing advanced technical skills.
With Tableau, you can uncover trends, patterns, and correlations within your data, making it easier to communicate complex insights to stakeholders.
2. Google Analytics

Google Analytics is a web analytics service that provides valuable insights into website traffic and user behavior. It helps businesses understand their audience, track key performance metrics, and assess the effectiveness of marketing campaigns.
From bounce rates to conversion tracking, Google Analytics empowers businesses to optimize their online presence for better user engagement and conversions.
3. Excel
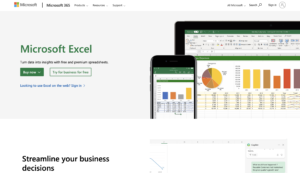
Microsoft Excel is a versatile spreadsheet software used for data organization, analysis, and visualization. While not specifically designed for advanced analytics, it remains a popular tool due to its familiarity and accessibility.
Excel’s pivot tables, functions, and charting capabilities allow users to perform basic data analysis and generate visual representations of data.
4. R
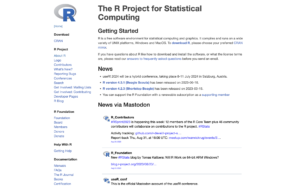
R is a programming language and environment designed for statistical computing and graphics. It excels in statistical analysis, data manipulation, and data visualization.
With a vast collection of packages and libraries, R offers advanced analytics capabilities, making it suitable for complex statistical modeling, machine learning, and data exploration.
5. Python
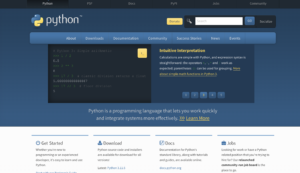
Python is a versatile programming language widely used for data analysis, machine learning, and web development. Its data analysis libraries, such as Pandas and NumPy, make it easy to manipulate and analyze data.
Python’s rich ecosystem of libraries, coupled with its user-friendly syntax, allows analysts to perform a wide range of data tasks, from data cleaning to predictive modeling.
6. Power BI

Microsoft Power BI is a business analytics tool that enables users to connect to multiple data sources, transform data, and create interactive dashboards and reports. With its user-friendly interface, Power BI allows for real-time data exploration, visualization, and collaboration. It’s especially powerful for businesses that rely on Microsoft’s ecosystem of products.
7. IBM Watson Analytics
IBM Watson Analytics is an AI-powered analytics platform that simplifies complex data analysis tasks. It assists users in data preparation, exploration, and predictive analytics.
Its natural language processing capabilities allow users to ask questions about their data in plain language and receive relevant insights.
8. SAS
SAS (Statistical Analysis System) is a software suite used for advanced analytics, business intelligence, and data management. SAS provides tools for data mining, statistical analysis, and predictive modeling.
It’s often preferred by large enterprises for its robust capabilities in handling complex statistical tasks and large datasets.
9. QlikView
QlikView is a data discovery and visualization platform that uses an associative model to allow users to explore data from multiple angles. It enables users to build interactive dashboards and conduct data analysis through dynamic associations, helping to uncover hidden insights and relationships within the data.
10. KNIME
KNIME (Konstanz Information Miner) is an open-source analytics platform that allows users to create data workflows through a visual interface. It supports data preprocessing, modeling, analysis, and reporting.
KNIME’s modular approach enables users to integrate various data processing and analysis tasks into a single workflow.
Each of these tools has its unique strengths and use cases. Choosing the right tool depends on factors such as your business needs, the complexity of analysis required, your technical proficiency, and the specific goals you aim to achieve through data analytics.
Ready to dive into the world of Business Analytics and unlock a future of data-driven success? Join our transformative Data Science and Business Analytics course at Accredian!
Whether you’re a beginner or looking to enhance your skills, our comprehensive program will empower you to harness the potential of these top-notch tools.
Ready to explore more? Head over to our blog page now and uncover the insights that could reshape your business journey.
Your data-driven future starts here!